The goal of a successful trader is to make the best trades. Money is secondary.
-Alexander Elder.
Momentum allows us to anticipate change in price action. Whether price action slows down, speeds up or changes direction, it can be quantified and displayed using momentum gauging indicators that can also help you identify accumulation and distribution. There are several indicators that help you with this. Let’s revisit the analogy I mentioned in chapter 1 again (hopefully this time it’s a bit simpler to understand): Let’s pretend you are training to compete for the Olympics so you can be the next Usain Bolt. On a long narrow track, your trainer will be recording every movement you’re making in relation to time and distance (this would be your indicators). Your job for this exercise is to reach one checkpoint to the next. Sometimes, the next checkpoint can be behind you. Your job for this exercise is to reach just these 2 checkpoints as fast as you can: checkpoint A is 250 meters north from the starting point. Check point B 300 meters South from A, so 50 meters south from the starting point. Okay, so you take your mark….and ready…set….go!! You start off slow but very rapidly you’re gaining velocity (trend continuation). You are now halfway through checkpoint A and you are in full sprint. You know that your next checkpoint is behind you. As you arrive at A, you know you can’t just touch checkpoint A and immediately turn around and head to checkpoint B without losing velocity or coming to a complete stop for a fracture of a second. Or you can stop and rest as long as you like, because you might be too out of shape and need to catch a breather (I call this “null point” where there’s equal pressure from buyers and sellers’ side). But you’re not out-of-shape. In fact, when you arrive at A, you slow down at the very last stretch, touch checkpoint A, turn around 180 degrees, and start heading to check point B (reversal or retracement occurs here). You slowly gain velocity and eventually you are sprinting past where you started (reversal now).
Imagine if you could see when the market is about to slow down and reverse. That can help you know how to prepare for future trades that can be extremely profitable. This is where you hear tons of people making generational wealth.
You can tell by looking at any chart what phase the market is in relative to the timeframe. When it’s in accumulation or distribution, the market is slowing down from a full sprint (markup/markdown). The market is never in a phase where it’s “deciding” or “consolidating”. We are always, always, always…. in one of the 4 phases. In other words, when people say, “oh the market is deciding what to do next… it’s under consolidation”, it’s simply not true. TA assumes everything is always priced in. Accumulation follows after a down move from the market to nullify the heavy sellers. Distribution follows after an upward move from the market to nullify the heavy buyers. It happens in all time frames and types of charts (volume, tick, time, etc…). Price action either goes up or down over a period of time (price action); so in order words:
Where P = Price and T = Time

∆P÷∆T=PRICE ACTION

Using the analogy I provided above, where S = speed (distance over time):

∆S÷∆T=VELOCITY
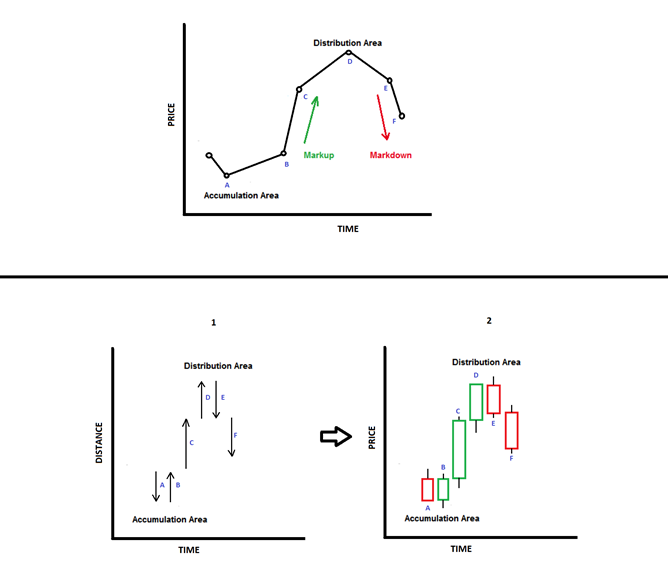
The image below shows you a very basic model of how price action looks from Wyckoff’s model to how we see it in a typical chart.

If

∆P÷∆T=PRICE ACTION

Then

∆PA÷∆T=PRICE ACTION MOMENTUM (PAM)

Using the sprinting analogy, where V = Velocity:

∆V÷∆T=ACCELERATION
So why is PAM an important value to get a feel for? It is because it helps us know the overall net emotion between the buyers and sellers. Is the market overbought or sold? This can help us know if we are about to see a change in trend. Luckily, we don’t have to do any math problems to calculate PAM at any given time. We can gauge PAM by using two lagging indicators: MACD and a “leading” indicator for MACD (Slow Stochastic). All indicators, by definition, are lagging indicators, but stochastic indicator can help us predict future MACD value and thus, helps us predict possible change in price action. I highly suggest googling up on these oscillators. If you don’t feel like googling, I’ve tried my best explaining it in layman’s terms while using textbook definitions for those that want to get into the details.
MACD and Stochastic are complementary indicators. This is a well-known fact amongst the trading community. According to Glenda Dowie from Investopedia,”ask any technical trader and they will tell you the right indicator is needed to effectively determine a change of course in a stock’s price patterns. However, anything one “right” indicator can do to help a trader, two compatible indicators can do better.” Not many traders use slow stochastic to help predict future MACD values. Although all indicators are technically lagging indicators, stochastic can be a leading indicator for MACD. So, both indicators have two lines that intersect each other all the time. And both have “slow” and “fast” lines. When either indicators’ fast line is above the slow line, it indicates there are more buyers than sellers. When the slow line is above the fast line, it indicates there are more sellers than buyers. When the lines touch each other, it is also called convergence. When the lines intersect each other, it is also called divergence.
So, when fast & slow lines are equal in value = convergence, Fast & slow lines are NOT equal in value = divergence has taken place, Fast line over slow line = positive divergence, Slow line over fast line = negative divergence.
Since both indicators help us define where we are in the market cycle, it comes down to the indicator’s cycle. Oh my god, not another cycle! I promise this one is easy to understand. Price action is in one of the following cycles: accumulation, markup, distribution, or markdown. To help us break down how these indicators can help us identify which cycle we are in, we must break down their cycle:
Convergence -> Positive Divergence -> Convergence -> Negative Divergence -> Repeat = Accumulation -> Markup -> Divergence -> Markdown
But remember all indicators are lagging indicators, so does that mean the second both MACD and Stochastic show positive divergence, we go long? No right. It’s only giving the face value of the current price action. For these indicators to be useful for us, we need to see them for what they really mean.
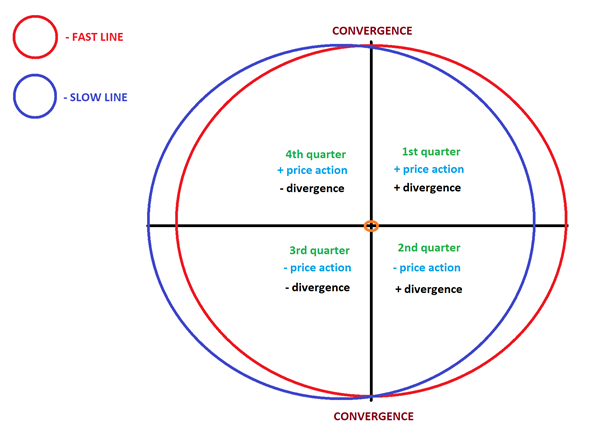
Imagine our planet rotating around the sun on a standard 2D axis. Imagine that these two oscillators are rotating around point (0, 0) or the sun. All we care about is the fast line value at any given time. And we know that both oscillators have a cycle. Convergence is always on the day when a new quarter starts. Shown below is how I see the cycle on each quadrant.

Notice how in the image above, the direction of price action does not have a direct relationship with divergence. However, at every convergence, we shift from positive to negative divergence or vice versa. This is because we now have a shift between buyers and sellers in the market. So how does this figure help you predict change in trend if it’s a lagging indicator?
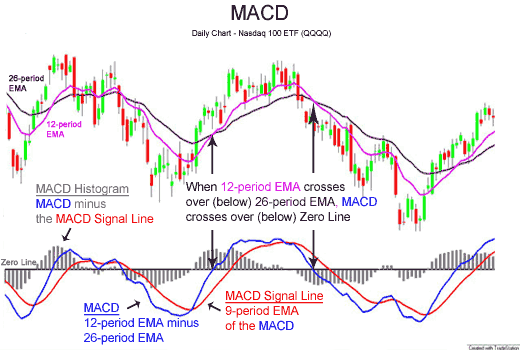
According to Adams Grimes: “MACD measures the changes in momentum of prices, but there tends to be some persistence in momentum, so it is acceptable to treat the MACD as a proxy measure of momentum. (That is to say, an increase in the rate of change of momentum will likely lead to higher momentum and vice versa.)” In his The Art and Science of Technical Analysis: Market Structure, Price Action, and Trading Strategies book, he mentions on page 202 that he uses a modified version of MACD. These inputs will later be stated. For now, understand what the default inputs (12, 26, & 9) mean. Look at the chart below.

All you need to take away from this is that MACD quantifies two trend indicators (12 EMA – 26 EMA = MACD) into a momentum indicator. The MACD is the faster line (blue). The fast line is “very sensitive to changes in the rate of change of prices. Read that again, carefully: the fast line swings up in response to the second derivative, or the rate of change of the rate of change of price. When we actually work with this tool, we usually think of it a little more loosely, as simply measuring the momentum of prices, but it is a good idea to be as precise as possible here at the beginning—this tool measures changes in momentum, not momentum itself” (Adam Grimes). Whereas the slower red line is the signal line. The signal line is a 9 period exponentially smoothed average of the MACD line. The signal line is usually slower in response to price changes compared to the MACD line. So, if the MACD line is above the signal line, it means there’s more buying than selling pressure. If the signal line is above MACD, then there’s more selling than buying pressure. A Wikipedia article mentions why the famous MACD input of 12, 26, & 9 is outdated. Same reason why Adam Grimes uses 3, 10, &16 inputs instead. You will notice that the fast line is a lot more responsive compared to the default input.
Does that mean you have to use Adam Grimes’ MACD inputs for trading? No. Does it help knowing you can mess around with the inputs depending on your trading style? Yes. Did I rely on the MACD indicator to get funded? No. So then why are we talking about this? Earlier, I said MACD can help you predict possible change in trend. This is different than taking trades at initial reactions at HOLB – LOLB or LOLT – HOLT ranges. Have you guys ever heard a trader saying he sees price action consolidating and sees a bullish or bearish MACD divergence? These divergences are usually categorized into bullish or bearish.
The stochastic oscillator was developed in the late 1950s by George Lane. In the 1984 magazine, Technical Analysis of Stocks and Commodities, Lane said in an interview that an oscillator follows the speed or momentum of price, and the momentum or speed of the price of a stock change before the price changes itself (pages 87-90).
According to fidelity investments, “the slow stochastic oscillator is a momentum indicator that shows the location of the close relative to the high-low range over a set number of periods. The indicator can range from 0 to 100. The closing price tends to close near the high in an uptrend and near the low in a downtrend. If the closing price then slips away from the high or the low, then momentum is slowing. Stochastics are most effective in broad trading ranges or slow-moving trends. The difference between the slow and fast stochastic oscillator is the [different smoothing] periods…setting the smoothing period to 1 is equivalent to plotting the fast stochastic oscillator.”
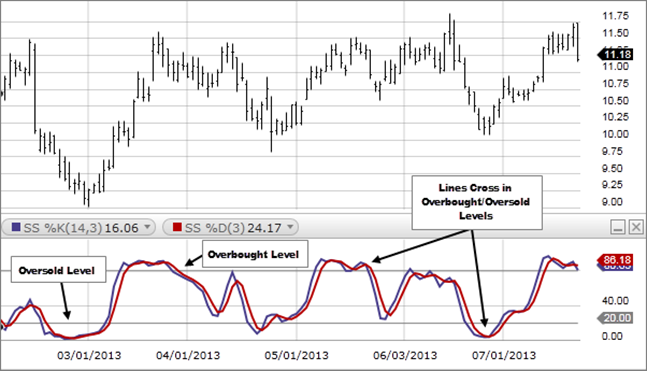
The way I like to think of slow stochastic relative to MACD is to how acceleration is to velocity. If we are losing acceleration over time, wouldn’t you expect the sprinter to also slow down in velocity? Eventually, the sprinter should come to a full halt, where he or she can take a walk, rest, or jog. If the sprinter decides to turn around and head back to the opposite direction, wouldn’t we be able to see him stop to turn around? When that happens, the indicators show a sign of divergences when both lines intersect each other. Shown below in figure 7.5 shows you the slow stochastic oscillator on the bottom half of the figure. Notice how at oversold areas, we see accumulation and areas at overbought show distribution.

Just like MACD bullish or bearish divergence, we also have stochastic bullish or bearish divergence. We can clearly see a bearish slow stochastic divergence occurring when price rallied towards $11+ during May and June.
If there’s one thing you can take away from this blog is that you can verify what phase we are in: accumulation, markup/down or distribution. This can help us look for possible trades soon or can help you avoid a major loss. Let’s take two real life examples I shared on twitter: Example 1: I’m looking at futures market on a lower timeframe. On LTF, $ES was losing momentum as price action kept rising. We see that when both MACD and stochastic oscillators are showing signs of bearish divergence. Just by seeing that, I am looking for shorts only. So, on December 7th, 2021, I knew that there would be an initial reaction when price action for $ES tests 4,711. 4,711 was also a ‘HOLT’ level. And on HTF, we could see the faster lines slowly losing momentum as well, so we knew even though we are in the ‘second quarter’ of ‘positive divergence’ cycle, we are about to see price action convergence. So why not have sell limit short orders ready at 4711 since both lower and higher timeframe are and will be in sync.


